The Supply Shortage and Shopping Habits
Christmas is the busiest holiday of the year with retail sales for 2021 predicted to rise towards $859 billion from $777.3 billion in 2020.
Unfortunately for many, supply chain issues are set to last until the new year, affecting the holiday season. This means families are at risk of being left empty-handed if they don’t start their shopping early enough.
Recommended Reading: Are Targeted Ads Ruining Christmas? [Survey]
To understand the impact of the supply shortage and the impact it may be having on how people across America are shopping for Christmas this year, we surveyed 1,044 people to understand if things have changed for them and how concerned people are.
Key findings:
- 60% of shoppers have altered their buying habits due to the supply shortage with 50% shopping earlier than normal
- 3 in 10 opting to shop at local smaller retailers with 20% buying fewer non-essential items
- 97.1% of shoppers using online shopping for Christmas 2021
- Amazon dominates Christmas shopping across the nation, as 38.8% of Americans search for Christmas gifts here
- 35% of Americans are willing to spend more money in order to avoid their gifts being delayed
60% of shoppers have altered their buying habits due to the supply shortage
We wanted to see if delays and shortages in the supply chain are already causing panic for shoppers and therefore impacting their purchasing decisions and habits. Here’s what we found:
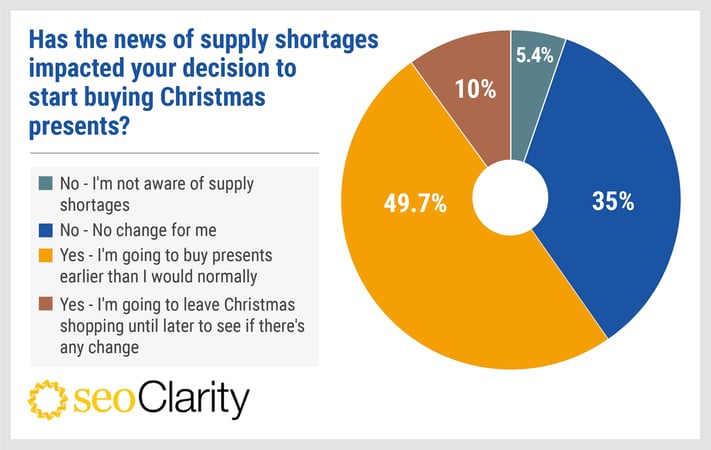
Our results found that over half (59.7%) of respondents have changed their buying habits as a direct result of the recent supply shortages.
Increased shipping delays and limited stock has forced 49.7% of holiday shoppers to purchase presents earlier than normal in order to avoid being left empty-handed.
However, at the other end of the scale, 1 in 10 (10%) of the respondents said that they would leave their shopping nearer to Christmas potentially risking not being able to gift their recipients as planned.
34% shopping at smaller local retailers due to the pandemic
Whilst many continue to make changes to their usual holiday shopping routine, we also wanted to know if the pandemic has had any effect on people’s attitudes towards shopping.
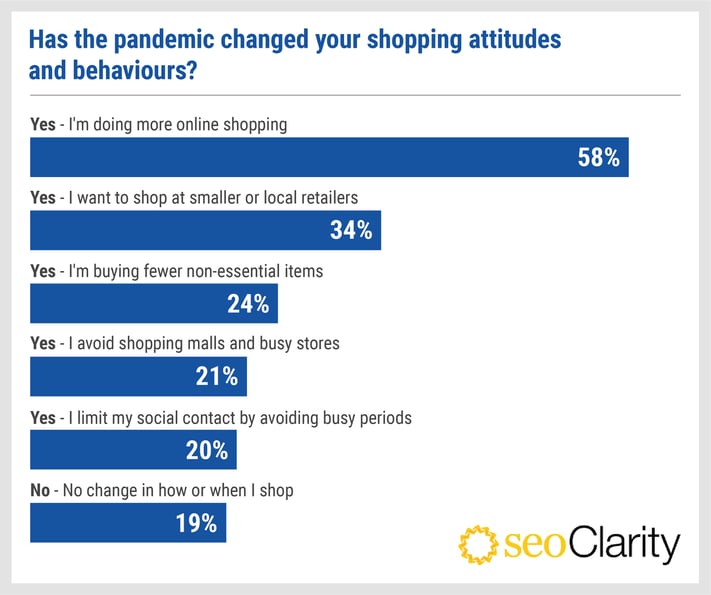
Our survey found that 24% of shoppers are choosing to buy fewer non-essential items whilst over 3 in 10 are opting to shop at smaller, local retailers. Many are choosing to avoid busy stores (21%) whilst 58% are avoiding in-store shopping and are instead shopping online where possible.
As people continue to remain safe where possible, the average amount of presents bought for each person by a shopper has decreased by 8.5%.
In previous years pre-pandemic, people on average said they would usually buy around 3.5 presents per person. However, in 2021, respondents said they would buy on average 3.2 presents per person.
97% of shoppers will purchase online for Christmas
While shopping habits are changing for many, online and other non-store sales are sure to rise again this holiday season.
In 2020, U.S. shoppers spent a huge $201.32 billion online during the holiday season, the vast majority (97%) of our respondents said they would be shopping online for some or all of their holiday gifts.
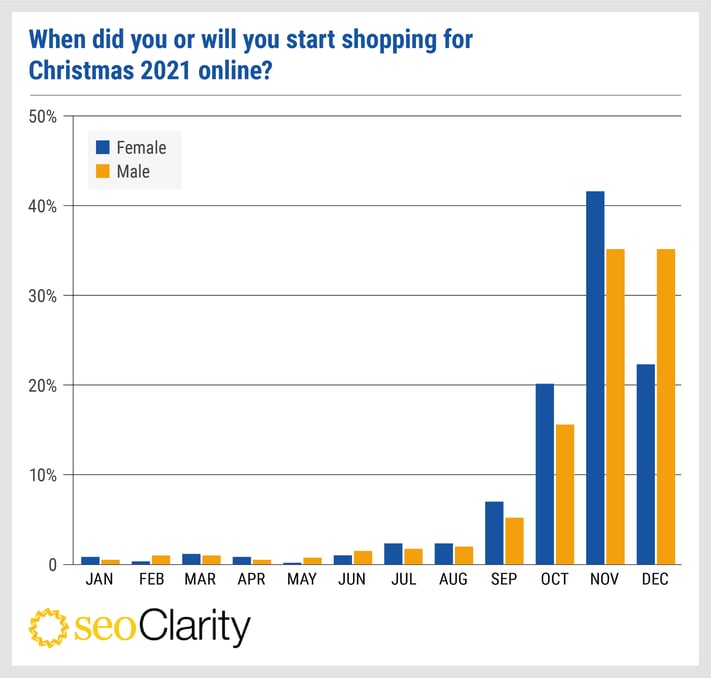
We wanted to find out when people will start shopping online for Christmas 2021 so we asked our participants which month they began. Of those who shop online, just over 1 in 3 (33.56%) started their holiday shopping before November.
In terms of gender, women (36.1%) tend to shop earlier than men (29.7%), being more prepared for the festive season, 27.1% of women shopped in September and October, compared to 20.8% of men.
Overall, November was the busiest month, with 41.6% of women shopping in this month, and 35.1% of men. This may not be surprising with November hosting huge sales such as Black Friday and Cyber Monday.
153% more Americans find shopping inspiration online compared to traditional media and shops
Even if shoppers aren’t buying online, they are still glued to their devices looking for inspiration.
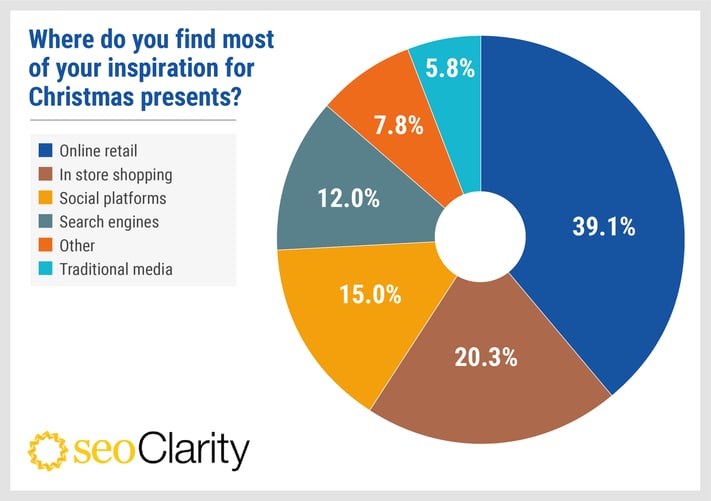
Amazon took first place as the most popular platform to find gifts with an average of 38.8% of shoppers using them as their primary source of Christmas present inspiration.
Instagram (9.5%), Facebook (2.2%), and Pinterest (2.7%), among other highly popular platforms leading in the world of social media, were also a popular choice with 15% of shoppers primarily looking at these platforms for ideas on what to gift their recipient.
While online platforms are the most popular amongst shoppers, in-store shopping is the second-biggest source of gift inspiration showing that in-store displays are still crucial. In fact, 62.5% of shoppers who look for gift inspiration online, then head into stores to purchase items.
1 in 3 would spend more money to try and combat shipping delays
With delays well documented in the news, we asked our respondents if they were willing to spend more cash to try and avoid delays to their holiday shopping.
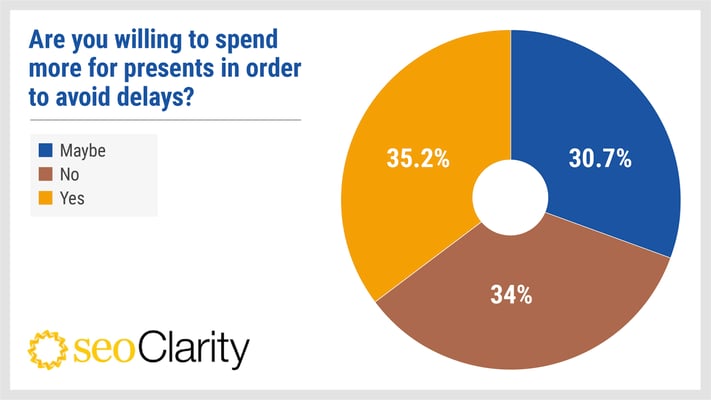
Our results found that over a third (35.2%) of Americans are willing to spend more money in order to avoid their gifts being delayed.
Of this third, 80% of the respondents have children, indicating that parents are more likely to try and combat supply delays by putting more money into their Christmas spending pot.
With 30.7% undecided, this could mean far more than 1 in 3 shoppers are going to be spending more to avoid supply delays this holiday season.
40% of shoppers would cancel delayed purchases in replacement for something else
Despite a third willing to spend more on preventing delays on their Christmas gifts, we also wanted to know what shoppers would do if the worst happened and they couldn’t get their purchases in time.
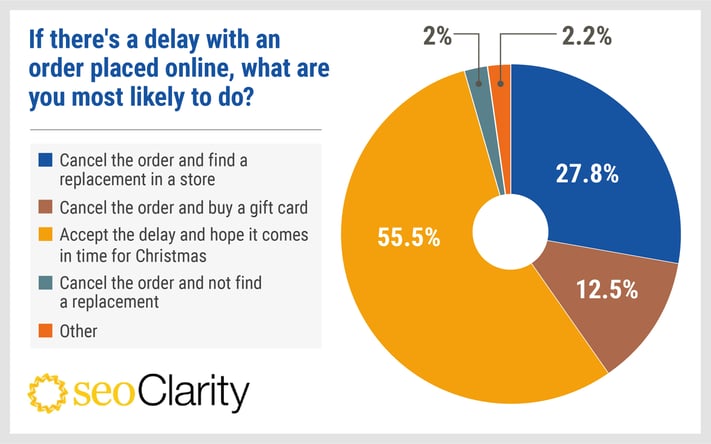
It seems online delays won’t deter people from spending money as 27.8% of shoppers said they would purchase a gift in-store to ensure their recipient receives a gift on time with 12.5% opting for a quick fix and choosing to purchase a gift card.
Over half of the recipients said they would accept the delay, potentially risking being left without their purchases in time for Christmas day.
Methodology
This survey was conducted in November 2021 and includes answers from 1,044 American adults.
The breakdown of the audience is as follows:
Gender:
- Female: 59.6%
- Male: 39.6%
- Prefer not to say: 0.5%
- Non-binary: 0.1%
- Agender: 0.2%
- Gender Fluid: 0.1%
Age:
- 18 - 24 years old: 9.4%
- 25 - 34 years old: 34.2%
- 35 - 44 years old: 28.7%
- 45 - 54 years old: 14.7%
- 55 - 64 years old: 9.6%
- 65+ years old: 3.4%
Have Children:
- Yes: 66.2%
- No: 33.8%


Comments
Currently, there are no comments. Be the first to post one!